About
A Data-Driven Exploration of the Race between Human Labor and Machines
“If you can’t measure it, you can’t manage it.”
- Peter Drucker
Anxiety about automation is prevalent in this era of rapid technological advances, especially in artificial intelligence, machine learning, and robotics. Accordingly, how human labor competes, or cooperates, with the machine in performing a range of tasks (what we term “the race between human labor and machines”) has attracted a great deal of attention among the public, policymakers, and researchers. While there have been persistent concerns about new technology and automation replacing human tasks at least since the Industrial Revolution, recent technological advances in executing sophisticated and complex tasks—enabled by a combinatorial innovation of new techniques and algorithms, advances in computational power, and exponential increase in data—differentiate the 21st century from previous ones. However, the oft-overlooked reality is that technology directly affects the demand for specific skills or tasks, instead of acting on occupations as a whole, and not all types of tasks are displaced by technology. Rather, technology can substitute for some human tasks, but can also augment human intelligence and complement specific types of tasks in ways that lead to higher demand for occupations in which those tasks are performed. The tension between automation and augmentation has been discussed in research and industry alike. Thus, a full picture of automation and the future of work requires a task-level, rather than occupation-level, understanding of not only technological change—to what extent a human task is automated—but also labor demand for occupations performing a task in recent years. To this end, we propose a data-driven methodology to scrutinize which tasks are more susceptible or complementary to automation in the 21st century, with respect to (i) changes in degree of automation and (ii) changes in employment share. By representing occupational skill requirements as a network, we reveal 15 endogenous task types which are clusters of related skills required to a similar extent by occupations, as shown below.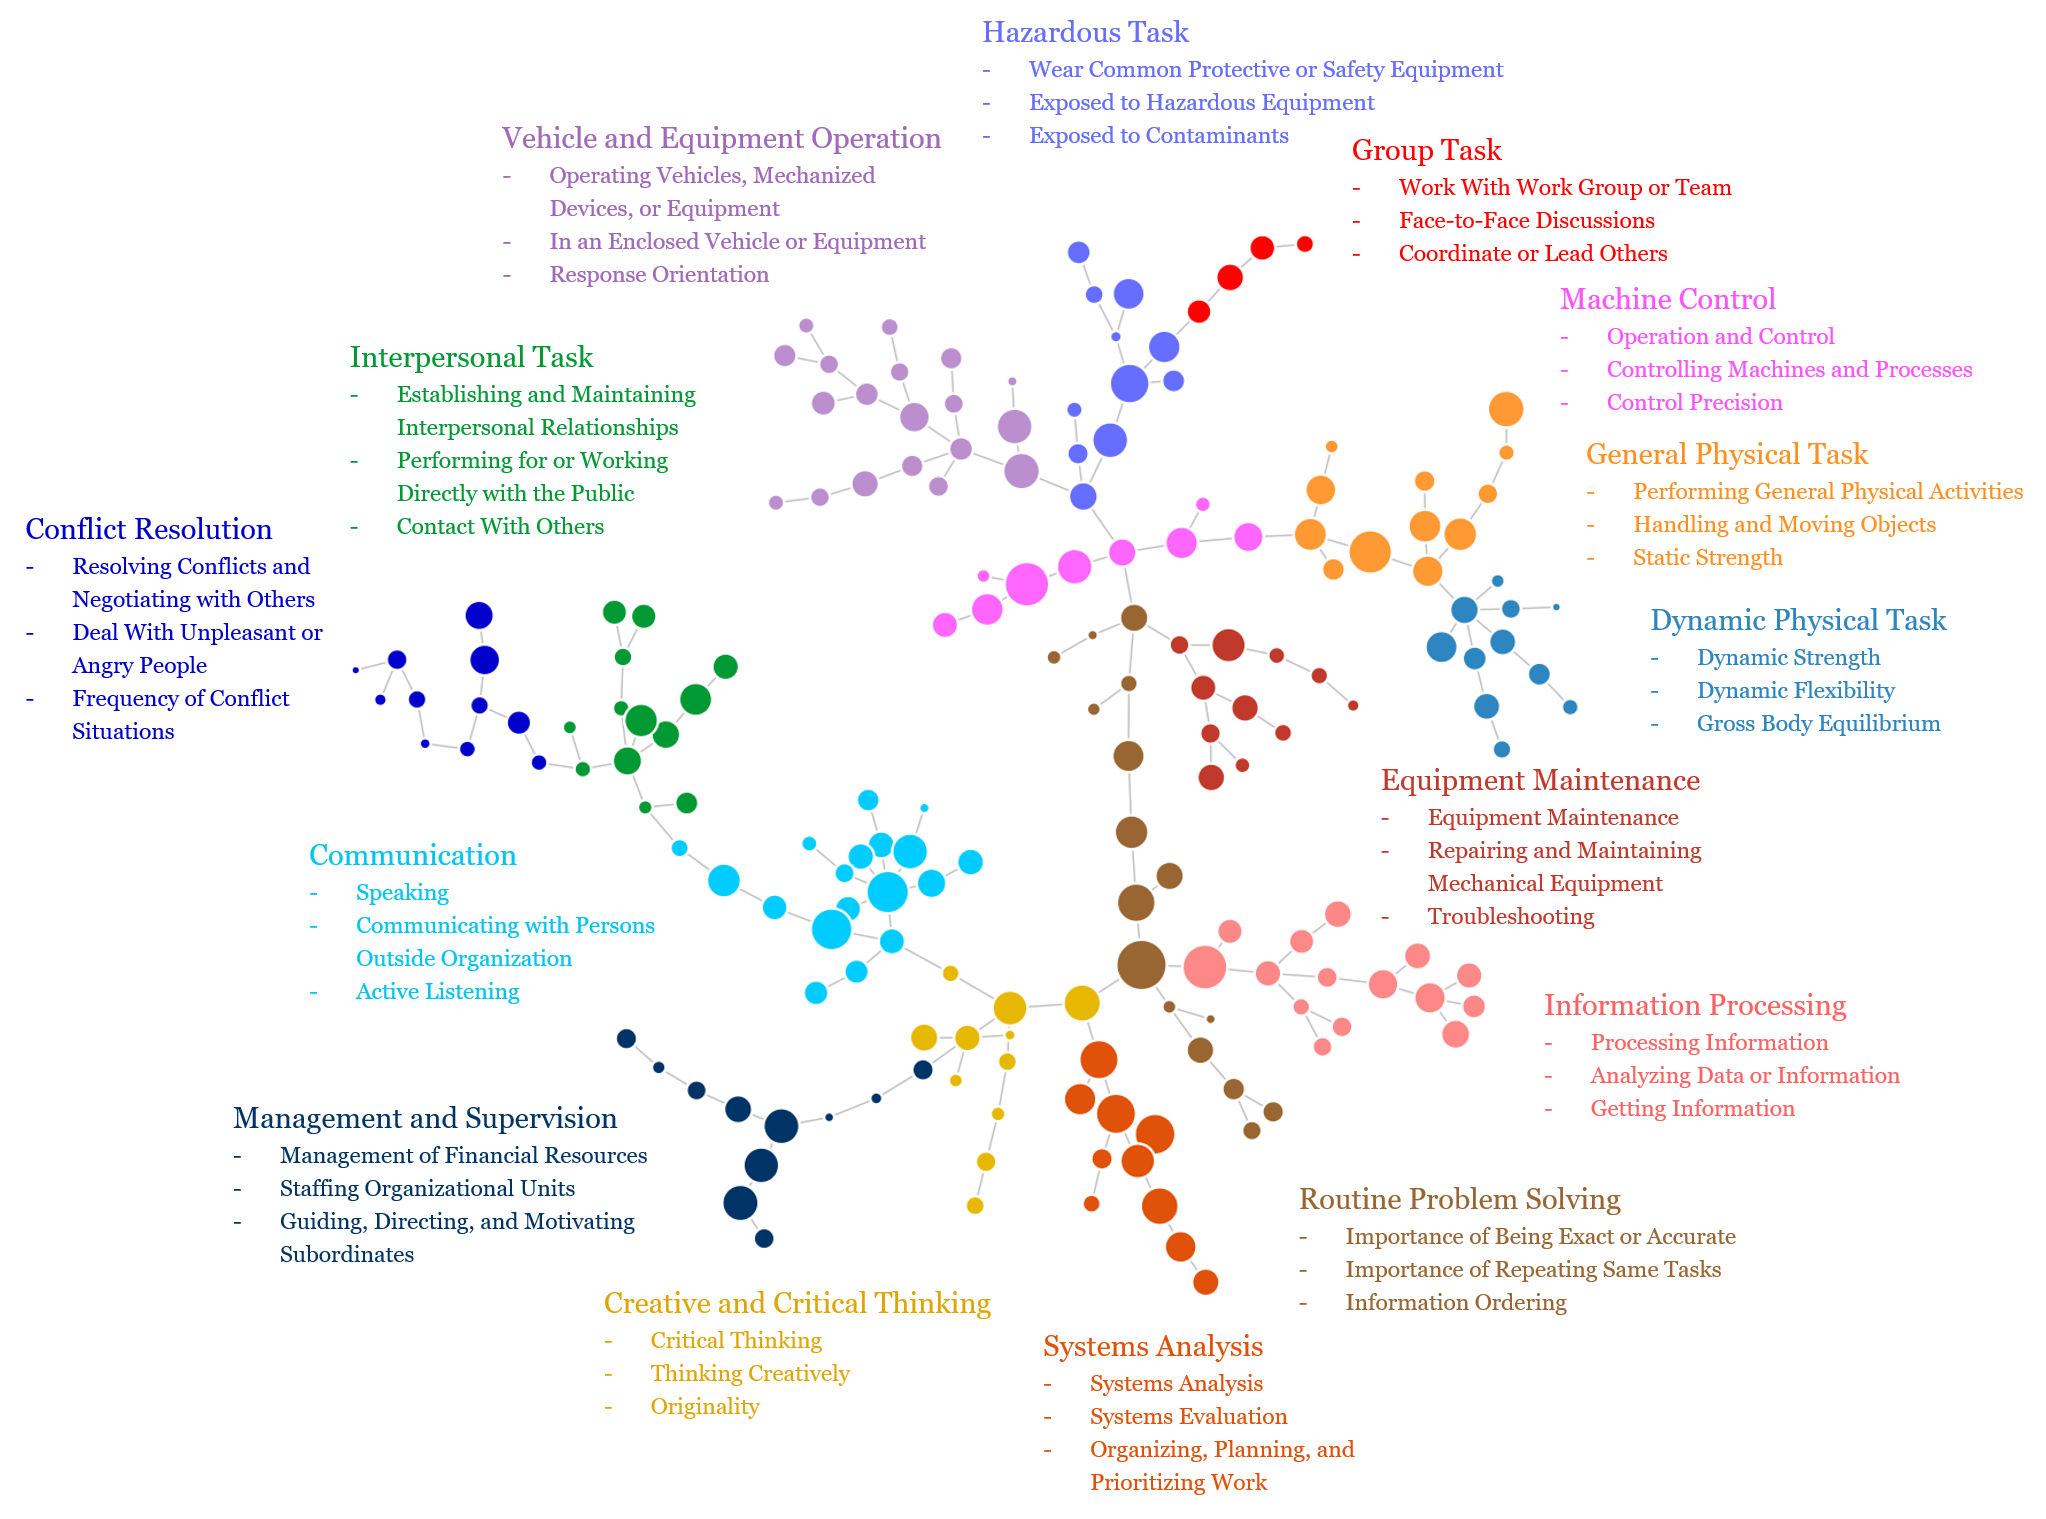 We then measure each task’s degree of automation in 2008 and 2020, respectively. Based on changes in degree of automation and employment share from 2008 to 2020, the task types are classified into five distinct categories as follows, highlighting that the increase in automation level does not always lead to a decrease in labor demand for the task.
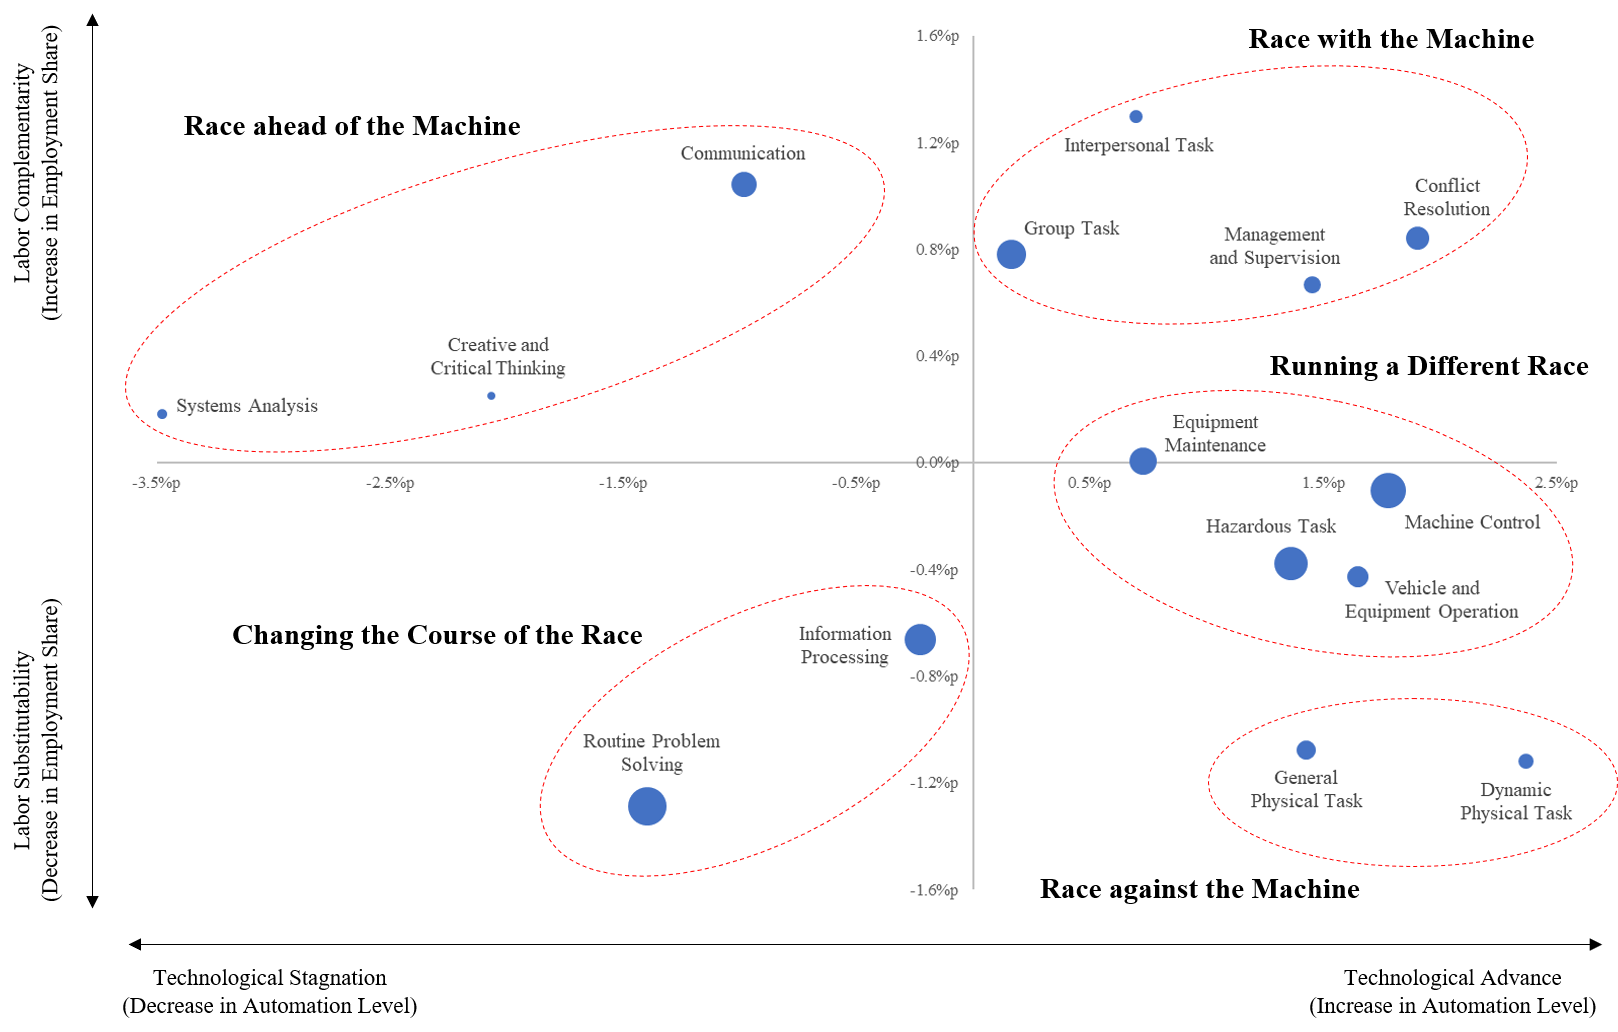
Note that the point size is proportional to the degree of automation in 2020.
- Race with the Machine: Tasks have experienced an increase in automation level, while the employment share for the tasks has increased from 2008 to 2020
- Race ahead of the Machine: Tasks have experienced a decrease in automation level, while the employment share for the tasks has increased from 2008 to 2020
- Changing the Course of the Race: Tasks were already highly automated in 2020, but have experienced a decrease in automation level, while the employment share for the tasks has decreased from 2008 to 2020
- Race against the Machine: Tasks have experienced an increase in automation level, while the employment share for the tasks has decreased from 2008 to 2020
- Running a Different Race: Tasks have experienced an increase in automation level, while the employment share for the tasks has remained relatively stable during 2008–2020
(1) Job Automation Index Demonstrate an occupation’s job automation index (2) Skill Network Visualize an occupation’s skill requirements and degree of automation (3) Task-Level Job Automation Sort all occupations by task-level job automation index (4) Automation Map (U.S. Cities) Visualize a city’s degree of automation in the United States (5) Task-Level City Automation Sort all U.S. cities by task-level city automation index
The entire source code is publicly accessible to encourage reproducibility at GitHub Link. Please see our research paper for detailed descriptions behind the job automation index. We welcome any comments and feedback on the research project and the website for job automation index.